Focusing on Mallards, Part III: Annual Changes in Flight Muscles

Content warning: This blog post contains references to the hunting, agriculture, and research practices of killing birds. If you choose not to read on, I respect and admire your choice.

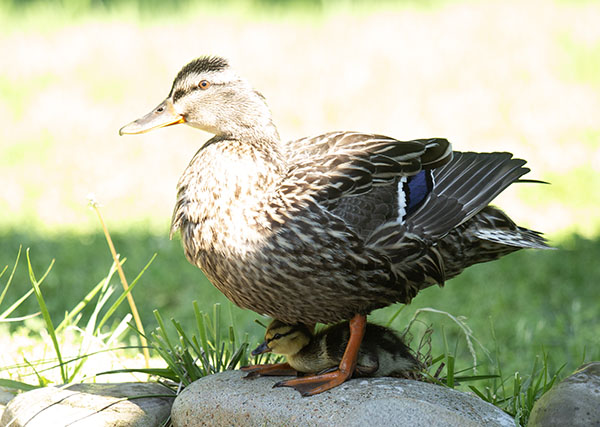
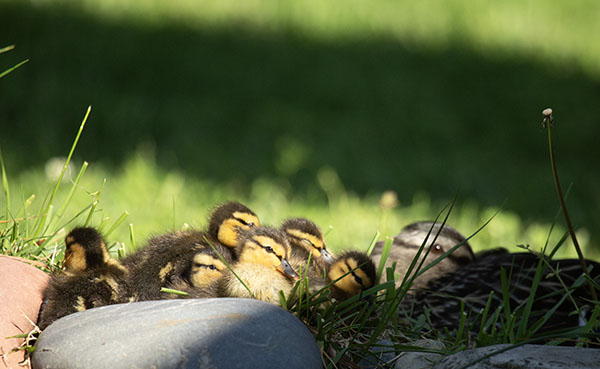
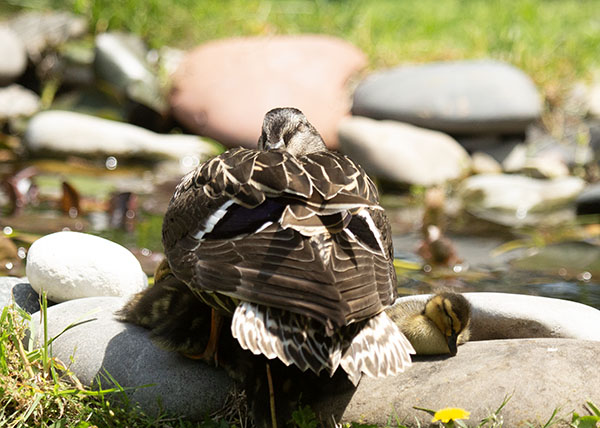
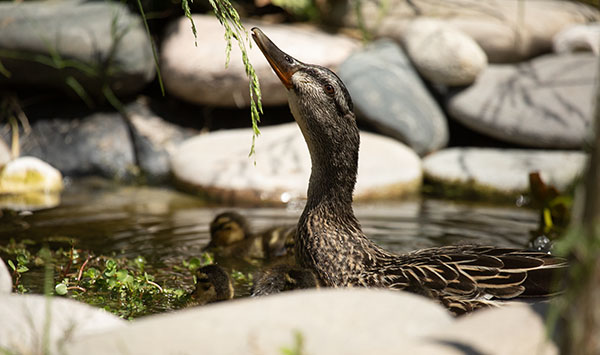
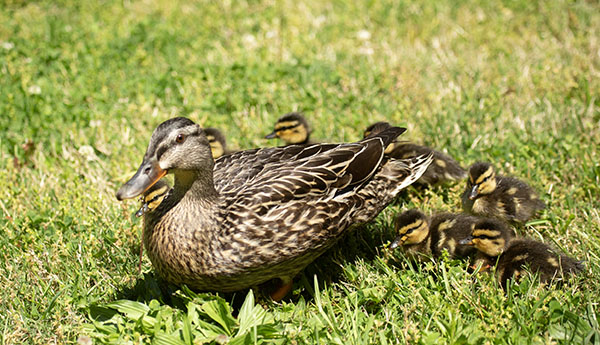
This multi-part series of blog posts was inspired by a Mallard hen that nested in our neighbor’s yard this spring. After her eggs hatched, the next-yard hen brought her nine ducklings to the dragonfly pond, where we all spent two lovely mornings basking in the relative safety of our tame little yard.

Photo of the next-yard hen and three of her ducklings. The ducklings are sleeping on the stone border of the dragonfly pond after a tiring swim, and the hen is standing in the grass behind them, preening her chest feathers.

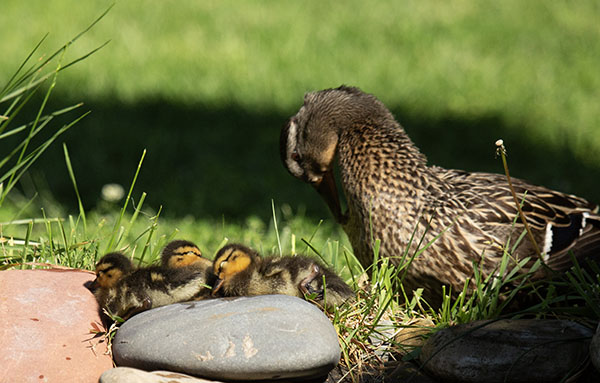
As I watched the hen rest and bathe and forage with her ducklings, I developed an obsession with Mallard physiology. This hen had incubated her eggs for almost the entire prior month, weeks and weeks of inactivity broken only intermittently to forage in nearby yards.

What happened in her body during that month? Especially in her flight muscles? After all, if I spent a month in bed, my muscles would deteriorate. And with the hen facing another dangerous stretch of weeks and months shepherding her flightless brood (ducklings don’t fly until they’re about two months old), what else was going to happen in her flight muscles? After three months mostly grounded, how could she fly at all?

Given my penchant for literature searches, I started looking for answers. A half-hour later my keyword nets were empty. Either I was choosing the wrong keywords, or the search engine ocean was empty, as well. But the search engine ocean is not the only source of information out there. Some answers are older than the internet. (Literature search side-quest unlocked!)

Giving up on keyword nets, I defaulted to my personal version of a bootstrapped search. I read through related papers, cherry-picked references that seemed pertinent, found the non-paywalled references, read more, picked more, and continued on repeat. Uncounted iterations later, I’ve devoted more hours to the search than can be explained by interest, alone. My OCD has clearly joined the hunt. (Obsession upgrade unlocked!)

Setting aside mysteries of my own neural wiring and firing, I’ve learned a lot about waterfowl. And about waterfowl physiology. So much so that I’m tempted to call myself a physiology hobbyist. And, like any good hobbyist, my current passions manifest in my blog.

Photo of two Mallard ducklings napping in bright sunshine beside a small yard-art statue. Some intangible and irresistible brew of nostalgia, biophilia, protectiveness, and obsessiveness caught and kept my interest during and after my encounter with this brood of Mallards.

Recap of Parts I and II

In Part I of this post, I described the anatomy of a bird’s flight muscles and shared a bit of personal history that helps explain why I am so fascinated.

In Part II, I defined what I mean by “knowledge”, reflected on the capitalism behind the curtain, sketched out some practicalities about Mallards and other waterfowl, introduced the literature’s euphemisms for “kill” (and also explained my choice to use the word “slaughter”), dipped into background about research numbers and repurposed data, and presented some findings from the literature about variations in the relative masses/sizes of flight muscles.

Here, I’ve harvested from the literature a few articles about annual changes in flight muscle mass in captive Barnacle Geese, wild Great Crested Grebes, wild Red Knots, and wild Mallards.

Photograph of the next-yard Mallard hen standing on the rock border of our dragonfly pond. One of her ducklings is crouched beneath her, safely hidden from aerial predators.

Flight muscles and annual cycles

All research is a tangled path, but wildlife research is a centuries long, thicket-strewn snarl of overzealous collection work, Larmarkian and Darwinian scuffles, rogue variables, and funding biases. Most of the research I’m citing here looked at flight muscle changes associated with molt cycles.

In all of the geese, grebes, and knots that embodied the data reported in these articles, the masses of their flight muscles decreased as their flight feathers molted and increased again as the birds regained feathers and flight. For most of the researchers who interpreted this data, these cycles of atrophy (muscle loss) and hypertrophy (muscle gain) were evidence supporting or refuting (for the species in question) a pair of proposed hypotheses.

The use/disuse hypothesis

One simple and obvious (hypothesized) mechanism for muscle gain and loss is use/disuse. When birds fly, they exercise their flight muscles and gain (or maintain) flight muscle through the known benefits of exercise. When waterbirds molt and replace all their flight feathers in a single weeks-long event, they lose muscle during molt because they quit flying. When they begin flying again, muscle returns.

Because simple and obvious tends to prove out (if you’re waiting for the obligatory Occam’s razor reference, here it is), I quickly became a fan of this hypothesis.

The “endogenous trigger” hypothesis

The more complex and less obvious (hypothesized) mechanism is an “endogenous trigger”. Perhaps somewhere in a bird’s body, some tissue or organ follows time (or seasons). Perhaps when the time/season is right, this tissue or organ sends a molt signal to the flight muscles, and the flight muscles begin breaking down. Maybe all that protein is needed for feather production (feathers are, for the most part, protein). Maybe birds with less muscle and therefore lighter body weights will regain flight sooner. Maybe some complex combination of diet, exercise, and behavior before and during molt causes muscle change as a side-effect, not as a benefit.

As complex and less obvious tends to make good storytelling (especially the kind of serendipitous discovery and cautionary tale stories that science loves), I quickly became a fan of this hypothesis, too.

In this photo, the next-yard hen has just settled after a vigorous, splashy bath in the dragonfly pond. Her feathers are ruffled and beaded with water, the feathers of her face and head are soaked, and a single drenched duckling is half-submerged in the last wave churned up by her luxurious bath.

Barnacle geese in molt

In the 2000s, researchers from the United Kingdom followed a flock of captive geese before, during, and after molt (or moult, because the UK).

Portugal et al. (2009) started with 40 adult Barnacle geese that had been bred and raised in captivity. These birds never flew. Their flight feathers were trimmed to keep them grounded in their aviary. Starting in July and continuing through November, the researchers slaughtered (anesthetized, euthanized, and later dissected) four birds from the flock every two weeks, with more frequent slaughter of birds during peak molt.

In this flock of flightless geese, flight muscle mass decreased by more than 35% in the weeks before molt and during the first stages of molt. After the mid-molt minimum, flight muscles started recovering, increasing back to the pre-molt maximum as the geese shed their old flight feathers and grew new feathers.

The researchers achieved this “35%” measurement by comparing the combined and averaged flight muscle masses of the slaughtered birds, four birds at a time. So the first four birds (the earliest data) had a combined and averaged flight muscle mass that was 35% heavier than the dissected and weighed, combined and averaged flight muscles of the four birds slaughtered mid-molt.1

Setting aside (for the moment) the steady depopulation of this flock, there was a timing mismatch between the muscle and feather changes. Instead of flight muscle loss following feather loss (as a “use it or lose it” consequence of flightlessness), the flight muscle loss preceded feather loss.

But why was there muscle loss at all? These geese didn’t fly, so their grounded condition during molt was their default lifetime condition. How could use/disuse factor in, when there had never been use in the first place?

Behavior changed, too

These same Barnacle geese had been observed through the previous year’s molt. “Despite having constant access to food, the captive barnacle geese lost approximately 25% of their body mass during the wing moult in both years of the study” (Portugal et al., 2007, “Discussion”, para. 1). This is a substantial change in body weight for geese with unlimited access to food and water.

“Anticipatory, rather than responsive.”

So these 40 captive Barnacle geese experienced flight muscle loss prior to onset of feather loss, before their behaviors and metabolisms changed. And their flight muscles began recovering prior to feather regrowth, before the geese resumed normal behavior.

“Therefore, these muscle changes give potential for increased or decreased performance but do so in an anticipatory, rather than a responsive fashion” (Portugal et al., 2009, p. 2409).

That’s an unexpected conclusion. These geese were not experiencing a simple and obvious use/disuse effect. This was a complex and less obvious process. A science story waiting to be told. And uncovering evidence of the complexity cost (only?) 40 captive geese.2

What is the value of a few flocks of captive geese?

Returning to my Part II theme of capital, what is the most valuable capital in the paragraphs above? Portugal et al.’s data, which has racked up some 200 citations? The 2007 and 2009 publications, which have been viewed online some 5000 times?

Is the story I’ve borrowed for this post more valuable than the geese? After all, these were fully realized, fully alive adult geese. Portugal et al. noted that 31% of the flock were paired or attempting to breed (2009, p. 2407). They did not note if they slaughtered the pairs together. Would such a consideration soothe my empathy?

And, speaking of empathy…

At what point, if ever, did the behavior and stress-metabolism of the flock—so accustomed to safety, steady population density, and shared companionship—change in response to their sudden prey status and declining numbers?

In this photo, the female Mallard stands watch as two of her ducklings practice hopping in and out of the dragonfly pond. Both ducklings have their stubby wings partially extended. During their two mornings in the yard, the ducklings stretched their wings often, as if practicing flapping, but they also used their wings as tiny counterweights while they balanced on the tricky terrain of seashells and stones around the pond.

Other waterfowl in molt

Between 1978 and 1986, a researcher in the Netherlands (Theunis Piersma) collected the carcasses of 112 adult Great Crested Grebes that drowned in gill nets during the birds’ August–October molt (or moult, because the UK version of English) on Lake IJsselmeer in the Netherlands. Pairing data with observations of the birds’ activity levels before, during, and after molt, Piersma interpreted his findings as use/disuse. As a cycle in Great Crested Grebes in which forced flightlessness triggered disuse atrophy during molt, and return of wing function triggered muscle hypertrophy after molt. (Piersma, 1988) 3

In separate work involving captive Red Knots, reported in 1999 (Dietz et al.) and more in keeping with Portugal et al.’s geese, Piersma (as a co-author with Dietz et al.) concluded a different mechanism was at work. In this instance, the authors concluded that an “endogenous circannual process” (p. 2836) regulated flight muscle changes in Red Knots during molt.4

All of this is good and useful information for researchers interested in captive geese, wild grebes, and captive and wild knots. It is even good and useful information for someone like me, who is dabbling through waterfowl research in search of a simple answer to a complex question about Mallards. It shows different physiological processes at work in different species.

In other words, my Mallard answers can’t be intuited from goose, grebe, and knot research.

Photograph of the next-yard Mallard hen and her brood settling down for a sunlit nap beside the dragonfly pond. The hen (in the background) has tucked her bill under her wing feathers in a resting pose, but she still has one watchful eye on her ducklings. The ducklings are huddled together, some still awake, some already asleep, and some just in the process of nodding off.

So…the next-yard Mallard hen’s flight muscles?

Simple answers to complex questions are vanishingly rare in any field, but perhaps a complex answer can by synthesized? Have the simple and complex threads of other, related questions about Mallards crossed often enough to create a pattern? (Unnecessary spoiler alert: No such pattern is discerned here. Only more questions.)

And, is molting at all the same as nesting? (No. Obvs.)

I found a significant body of literature regarding flight muscle changes in Mallards during molt, but only a single flight muscle dataset for nesting Mallards in the wild. I expect ethical concerns explain much of the data imbalance. At least, I hope ethical concerns are a factor.

I prefer a world in which nesting and post-nesting hens, along with their eggs and ducklings and awkward teen-ducks, are safe from the traps and slaughter and scales of researchers. Their world is already dangerous enough.

Besides, even if everyone agreed on a single, simple mechanism for molt-related muscle loss and gain in Mallards, it’s unlikely that the consensus mechanism would also regulate muscle physiology during nesting. After all, molt and nesting share few behavioral, metabolic, or seasonal similarities. For the birds themselves, flightlessness may be the only common factor. And nesting flightlessness is, at least during the onset, choice—nesting hens can fly, they simply don’t fly often. Molt flightlessness is forced.

Mallards in molt

Venturing first into Poland, a 1990 article (Panek & Majewski) looked at Mallards in molt on the floodplain where the River Warta meets the Odra River in western Poland. During the time of the study, some 25,000 male Mallards gathered for molt, a population “many times greater than the number of local breeders” (p. 255). Molting Mallards (3,788 males; 341 females) were herded into net enclosures, weighed, examined, and banded, and then released. After periods of 3–9 days, more herding resulted in recapture of 337 male and 13 female birds, which were again weighed, examined, and released.

These efforts allowed the researchers to determine that both the male and female Mallards lost 12% of their body weights during molt. What’s more, whenever new feathers (even just a few new feathers) were damaged enough to require immediate re-replacement, the prolonged flightless period resulted in continued weight loss. In those cases, the continued weight loss couldn’t be blamed on the metabolic demands of massive feather regrowth because only a few feathers were being replaced. (Panek & Majewski, 1990, p. 258)

“In our opinion, limited foraging and the use of body reserves during flightlessness are responses to high predation on dabbling ducks that forage in shallow waters. Secretive behavior and short forays out of shelter minimize exposure to predation” (Panek & Majewski, 1990, p. 258).

But a hemisphere away in Klamath Basin, California, avian botulism has sometimes been a larger hazard for molting Mallards than predation. In some of the basin wetlands between 2001 and 2006, avian botulism claimed as many as 64% of radio-monitored Mallards during molt (Fleskes et al., 2010, p. 214).5 However, after molt, “Hunting was the main cause of mortality for post-molt Mallards both within (16 of 37 deaths) and outside Klamath Basin (six of nine deaths)” (p. 214).

“Increased daily mortality rates of light-weight birds that were captured late in the season during this study suggest some aspect of the molting marsh (e.g., food, water quality, sites safe from predators, predator density) deteriorated as the season progressed causing female Mallards in poor condition to be more susceptible to predation and disease” (Fleskes et al., 2010, p. 217).

Finally, in the Mingo Basin of Missouri, a researcher from the University of Missouri slaughtered a total of 267 female Mallards over the course of three successive winter seasons (1981–1983) (Heitmeyer, 1988). He found that molt timing varied according to age and weather. Adult females molted earlier than immature females, and all of the birds molted earlier in wet winters.

After processing the carcasses, Heitmeyer noted that the birds he slaughtered either before or after molt were heavy, with lipid reserves making up a high percentage of their body weights (1988, p. 673). In other words, the birds Heitmeyer slaughtered prior to molt were healthy and fit and well-prepared for the metabolic demands of molt, and the birds he slaughtered after molt were also healthy and fit and well-prepared for the metabolic demands of migrations to their nesting grounds.

But mid-molt? The Mallards he slaughtered mid-molt were 6% lighter in weight than pre- and post-molt birds. Most of this overall weight loss was due to a 35% decrease in lipid mass (compared to pre-molt birds). So used-up lipid reserves explained 83% of the weight difference between Mallard hens slaughtered prior to molt and Mallard hens slaughtered during the middle of their molt. The hens were losing mostly lipid reserves, not muscle. (Heitmeyer, 1988, p. 673 & “Table 3”, p. 672)

Do these three researches tell a common story?

Not really.

It’s tempting to weave these three researches into an intuitive story about Mallards that reads something along these lines: Mallards lose weight during molt because they hide from predators more and forage less, and their used-up lipid reserves (not atrophied flight muscles) represent most of the lost weight.

But science doesn’t work that way. Nothing does, really. I can’t take the 12% weight loss (Poland), explain it as 83% due to used-up lipid reserves (Missouri), and superimpose an estimate of up to 64% of molting Mallards dying due to disease (California). None of these numbers, variables, or Mallard populations are connected in any rigorous or meaningful way. The only commonalities are the English-language phrase “Mallards in molt” and this sprawling series of blog posts.

Even so, there are tempting threads. Perhaps Mallards in Poland, Missouri, California, and everywhere else actually do lose weight during molt because they hide from predators more and forage less, and perhaps their used-up lipid reserves (not atrophied flight muscles) actually do represent most of the lost weight.

Perhaps Mallards need a third hypothesis, something neither use/disuse atrophy nor annual endogenous trigger. Perhaps if I keep pulling this molting Mallards thread long enough, keep following it deeper into the rabbit hole that I already know doesn’t hold the answer I’m seeking, I’ll find other researchers pulling the same thread. Perhaps we’ll all agree that Mallards need a purely behavioral “hide and fast” hypothesis.

Except it’s time to follow this particular thread back out of the rabbit hole. Whatever mechanisms are at work in a molting Mallard’s physiology, they are (probably) irrelevant to a nesting Mallard’s physiology. (But, as I leave, I’m rolling up the thread metaphor and carrying it with me to the next rabbit hole.)

In this photo, the Mallard hen and her ducklings are perched again on the rocks surrounding the dragonfly pond. Most of the ducklings have gathered under the hen, in the enlarged patch of shade that she has made by spreading her tail feathers and slightly opening her wings so that her primary and secondary flight feathers catch a bit more of the sun. Two of the ducklings are several inches beyond the hen's shade, enjoying the sun-warmed rocks.
In this photo, the Mallard hen and her ducklings are perched again on the rocks surrounding the dragonfly pond. Most of the ducklings have gathered under the hen, in the enlarged patch of shade that she has made by spreading her tail feathers and slightly opening her wings so that her primary and secondary flight feathers catch a bit more of the sun. Two of the ducklings are several inches beyond the hen’s shade, enjoying the sun-warmed rocks.

I like the thread metaphor because I like the idea of reality as a giant tangle of skeins. Step up to the skein, find a loose end, and start pulling. This is how some hypotheses unravel and how some hypotheses knot tighter.

But don’t forget that each thread has a price tag. Like a county fair booth where you pay 40 captive geese to pull the first thread. Or a boat full of drowned grebes to pull the next thread. Or, as in the next research, 51 Mallard hens to pull the specific thread I’ve been searching for all along.

Flight muscle changes in nesting Mallards

“By late incubation, females are highly emaciated; 11 live-trapped females weighed during the last 5 days of incubation averaged 900.3 g ± 30.1 g (mean ± SD)6, or 25% less than during prelaying” (Krapu, 1981, p. 31). (For readers accustomed to weights in pounds and ounces, 900.3 grams = 1.98 pounds and 30.1 grams = 0.066 pounds.)

While 11 ducks is a very small sample size, the data suggest that female Mallards lose up to a quarter of their body weight over the course of nesting. But do they lose flight muscles or lipid reserves? Or both?

Along with these 11 hens weighed alive, this study involved capturing and slaughtering 51 other Mallard hens who were at various stages of their nesting cycles: 19 pre-laying hens, 11 laying hens, and 3 hens that had completed the laying process and begun incubating their eggs. Plus 11 hens that were making their first nest and 7 hens that had lost their first nests and begun laying a new clutch.7

Here’s those numbers again, with a bit more context

If you read the previous two paragraphs and experienced a brief or extended period of dissonance, I’m with you. That’s a lot of numbers in just a few sentences. The important numbers, for my purposes, are the 25% weight loss, the 11 weighed hens, and the 51 slaughtered hens. Here’s a list of hens, broken down by how their data were sorted:

  1. Eleven hens were trapped, weighed, and (hopefully) released back to their nests. These 11 hens were nesting within the study area, and each had a nest with eggs due to hatch within five days. All of these hens were in poor body condition (“emaciated”) compared to hens that had been weighed prior to laying.
  2. Thirty-three hens were slaughtered after migrating into the study/nesting area. As the researchers dissected the 33 carcasses, the slaughtered hens were divided into groups based on their ovarian cycles:
    • Nineteen hens had not yet ovulated. These 19 hens were labelled as “pre-laying”.
    • Eleven hens had ovulated and begun laying eggs, but had not yet laid their last egg. These 11 hens were labelled as “laying”.
    • Three hens had laid all of their eggs (had no more eggs developing in their ovaries or oviducts) and had begun incubating their nests, but they were no more than 6 days into their incubation phase. These 3 hens were labelled as “incubating.”
  3. Eighteen hens were slaughtered as their ovaries and oviducts began preparing for egg production, but before their first egg ovulated. (It’s unclear if these hens were counted among the hens sorted by ovarian cycle, above, so I’m counting them separately.)
    • Eleven of these hens were making their first nest. These 11 hens were labelled as “initial nest attempts”.
    • Seven hens of these hens had a “brood patch” (a bald/featherless patch on their chest or abdomen), which was considered to be evidence that they had already completed one nest and begun incubating (brooding). But something had gone wrong with the first nest, prompting the hens to restart their ovarian cycle and attempt a second (or third?) nest. These 7 hens were labelled as “renesting”.

(Did you spot the moment(s) when my OCD winced? There ended up being three different groups that numbered 11 hens. This kind of number coincidence is not exactly common in science, but also not exactly uncommon. My OCD does not like coincidences. It’s safe to say that, in general, science doesn’t either.)

Back to North Dakota in springtime

When Krapu compared the weights of various tissues and organs in his slaughtered hens, the laying hens (layers) had actually gained weight, compared to the pre-laying hens (pre-layers), while the incubating hens (incubators) had lost a significant amount of weight compared to both the pre-layers and the layers.

The idea that Mallard hens might gain weight in the early stage of egg laying makes intuitive sense. Think about birds and eggs and ovaries and oviducts. All of those eggs started as follicles in an ovary. Think about eggs in a nest. They’re certainly bigger than ovarian follicles. After all, each egg has to be fortified with enough proteins and lipids and sugars to build an entire duckling from scratch. So producing a nest full of eggs, ovary to nest, means a female Mallard’s reproductive tract gets huge.

As Mallard hens lay (on average) an egg a day during nesting, their ovaries and oviducts during this time often contain several eggs in various stages of growth from follicle to in-the-shell. Krapu’s data support this intuitive explanation. The layers had massively higher ovarian and oviduct weights than the pre-layers and the incubators. (I’m going to call this their pregnancy weight.)

In comparing hens slaughtered at these three stages—pre-layers, layers, and incubators—three trends of interest (to me) emerged:

  1. The incubators had lost their pregnancy weight, and then some. Their ovaries and oviducts were not only lighter than the ovaries and oviducts of the pregnancy-heavy layers, but were also significantly lighter than the ovaries and oviducts of the pre-laying hens. (Have mercy. Statistical significance is its own hefty topic.)
  2. The incubators’ lipid reserves were nearing depletion. The pre-layers’ total lipids made up some 10% of their overall body weight. For the layers, their total lipids made up about 6% of their body weight. But the incubators, by day 6 of incubation (and with some 3 weeks left to go), were whittled down to the point that their total lipids constituted only about 2% of their body weight.
  3. The incubators’ flight muscles were lighter than the pre-layers’ and layers’ flight muscles, though the difference was not statistically significant.

And what about later in incubation? What about weeks 2–4? With lipid reserves already nearing depletion, muscle would be next on the menu. Thankfully, this research didn’t persist in slaughtering nesting Mallards. There are no numbers for weeks 2–4. But there are numbers for those seven hens that lost their first nests and tried to start over.

The seven renesting hens had already gained and lost their pregnancy weights once, and their body weights reflected the toll. They were about 12% lighter than hens at the same stage of laying a first nest (though they were slightly heavier than the incubator hens). Their lipid masses were only about 3% of their body weights, as they had used up much of their lipid reserves during their first nesting attempts.

And their flight muscles? In all the hens, no matter their nesting count or stage, their flight muscles made up 5–6% of their body weights.

Pre-layersLayersIncubatorsInitial NestersRenesters
Body weight1199.8 ± 781300.6 ± 114.6967.3 ± 44.51217 ± 79.4 1065 ± 54.6
Flight muscle weight65.1 ± 5.665.1 ± 5.558.3 ± 1.965.3 ± 5.660.0 ± 1.9
Flight muscle as rough % of body weight5.4%5%6%5.3%5.6%
Lipid mass109.6 ± 33.779.6 ± 37.217.1 ± 14.7116.4 ± 18.9 29.9 ± 17.4
Lipid mass as rough % of body weight9.1%6%1.8%9.6%2.8%
All weights are in grams. Body weights, flight muscle weights, and lipid masses are quoted directly from Krapu, 1988, Tables 1 & 3, pp. 31 & 35. Flight muscle as rough % of body weight and lipid mass as rough % of body weight were calculated by dividing flight muscle weights and lipid masses by the respective body weights, then multiplying by 100. Should there be any statisticians among my readers, I offer my deepest apologies for ignoring those standard deviations. I was only looking for rough numbers, after all.

Question answered? (No.)

Maybe nesting female Mallards don’t lose significant flight muscle. Maybe used-up lipid reserves and back-to-normal reproductive tracts explain all of that lost body weight, up to 1/4 of their pre-nesting weight. Maybe a nesting Mallard’s flight muscles only atrophy a little? (Unlike Western Grebes in Manitoba, Canada, which lose up to 41% of their flight muscle during nesting—males and females alike (Piersma, 1998, pp. 101–102 & Table 4).)

Maybe. But not likely. After all, the incubators had only been on their nests for up to 6 days. The renesters were still preparing to lay new clutches of eggs, still carrying new rounds of pregnancy weight, and hadn’t started incubating at all. The incubators averaged a weight of 967.3 grams (about 2.1 pounds) and the renesters 1065 grams (about 2.3 pounds).

Somewhere between renesting or early incubation and about 5 days prior to their eggs hatching (3 weeks or so), both incubators and renesters would have been expected to lose more weight. Perhaps even down to the weights recorded for those 11 captured-and-weighed (and hopefully released back to their nests) hens—about 900.3 grams (1.98 pounds).

If statistics mean anything, and if the 11 hens captured and weighed alive were at all representative of North Dakota’s nesting Mallard hens in the spring of 1981, all of the slaughtered hens’ weights would have fallen to about 900.3 grams (1.98 pounds) before their eggs hatched. Another expected weight loss equalling roughly another 7% of the incubators’ and renesters’ body weights. With lipid reserves already diminished, some notable proportion of that 7% would have been muscle.

But, which muscles?

Only the Mallards know.

And I’m content with that answer.

Photograph of the Mallard hen and one of her ducklings floating in the dragonfly pond. Both are keeping one eye on me and my camera. The duckling's down is beaded with tiny water droplets, and the hen's feathers are ruffled and damp from her bathing. Their futures are unknown, as is mine.
Photograph of the Mallard hen and one of her ducklings floating in the dragonfly pond. Both are keeping one eye on me and my camera. The duckling’s down is beaded with tiny water droplets, and the hen’s feathers are ruffled and damp from her bathing. Their futures are unknown, as is mine.

Happily, others are content with that answer, too:

“Wild Mallards breeding under natural conditions are poor subjects on which to accumulate statistically sound population parameters. The species is particularly sensitive to human interference, especially during the brood period. Statements such as ‘unstudied Mallard populations easily maintain themselves’ might be viewed as a general truism. Field workers concerned with duck population dynamics should periodically remind themselves of the Heisenberg Uncertainty Principle (TIME, Canadian Edition 04/15/63, p. 51), ‘the very act of observing or probing a phenomenon changes the phenomenon'” (Dzubin & Gollop, 1971, p. 49).

So, is this the end of these Mallard posts?

Of course not. I have OCD, and I’m perseverating on Mallards. But this is the end of my riff about flight muscle physiology.

The rest of my Mallard series will pull some Mallard hunting threads and some Mallard farming threads, which intersect at ongoing policy controversies surrounding releases of farmed Mallards into the wild.

Photograph of the next-yard Mallard's ducklings learning to dabble in the dragonfly pond. All are fluffy and downy and beaded with water droplets. All nine ducklings have little Mallard eye stripes that serve as excellent camouflage in the wild. The eye stripes also provide a touch of exaggeration, in a camera lens, mimicking grumpiness from some angles and endearing curiosity from other angles.
Photograph of the next-yard Mallard’s ducklings learning to dabble in the dragonfly pond. All are fluffy and downy and beaded with water droplets. All nine ducklings have little Mallard eye stripes that serve as excellent camouflage in the wild. The eye stripes also provide a touch of exaggeration, in a camera lens, mimicking grumpiness from some angles and endearing curiosity from other angles.

Notes

1. I spy an uncontrolled variable! Because each two-week data set involved slaughtering four birds, in order to dissect and weigh their flight muscles, each two-week data set is an end point. Those four individual birds couldn’t be followed any further. So comparisons of the data sets, comparing the data recorded for the first four birds against the data recorded for any other four birds, requires an assumption that these birds had no significant individual differences. While this is a well-accepted research method, and while individual differences are unlikely to perturb or confound the conclusions, I’m putting a pin in this “individual variation” variable. (Click here to return to your regularly scheduled paragraph.)

2. Okay, yes, I agree. The geese weren’t the only cost. There is a lot of human labor behind this (and all) research. For the researches reported here, and because I’ve brought it up, it’s worth quoting the authors’ acknowledgments (BBSRC=Biotechnology and Biological Sciences Research Council, UK):

  • “We are grateful to Alan Gardner, Phil Archer, Ben Heanue and Pete Jones, for looking after the geese. We are very grateful to Craig White for practical help with the birds and logistics, and Jon Codd and Peter Tickle for supplying us with anatomy guides. Thanks also to Graham Martin, Theunis Piersma, Caroline Chadwick, Robert Ker and McNeil Alexander for useful discussions, and two anonymous referees for their comments. S.J.P. and J.P.M. were funded by the BBSRC” (Portugal et al., 2009, p. 2409).
  • “We would like to thank Craig White for his assistance with the respirometry equipment and set-up, and for statistical advice. We are also grateful to Alan Gardner, Phil Archer, Ben Heanue and Pete Jones for looking after the geese and helping with the weighing sessions. Thanks also to Peter Frappell for help with software, and Michael Romero, Graham Martin, Jim Reynolds and Lewis Halsey for useful discussions. This work was supported by the BBSRC” (Portugal et al., 2007, p. 1396).
  • Click here to return to your regularly scheduled paragraph.

3. Halfway through wing molt, fewer grebes drowned in gill nets. The author notes that the half-molted grebes must either dive less often to forage or dive less deeply (p. 99). Grebes that drowned during wing molt weighed some 9–15% less than grebes that drowned midwinter, but this decrease in body mass involved mostly a loss of fat mass, which was 53–60% decreased during molt as compared to midwinter fat reserves. Despite the fact that most of the weight loss could be explained by loss of fat reserves, flight muscle masses were 28–30% lower in grebes that drowned during molt. So somewhere in the grebes bodies, some organ or tissue increased during molt, offsetting the muscle loss. The author suggested possible liver enlargement, as the liver processes proteins and feather replacement requires a significant investment of protein. (Piersma, 1988, p. 97) Click here to return to your regularly scheduled paragraph.

4. The authors looked at two subspecies of Red Knot that gather on the Dutch Wadden Sea in August. One subspecies, Calidris canutus islandica, undergoes wing molt in August and overwinters in western Europe and the Mediterranean before migrating to arctic regions in Canada, Greenland, and Svalbard for breeding and nesting (Baker et al., 2020, “Subspecies” para. 3, Dietz et al., 1999). The other subspecies, Calidris canutus canutus, stops on the Wadden Sea in August to build reserves in preparation for a 4500km (about 3000 mile) migration to western and southern Africa, where the birds overwinter (or oversummer, for the birds that cross into the Southern hemisphere) and finish their wing molt in March or April before flying back to Russia for breeding and nesting (Baker et al., 2020, “Subspecies” para. 2; Dietz et al., 1999).

In a rare (in my reading for this post) work that did not rely entirely on dissection to measure flight muscles, the researchers captured four individuals of each subspecies of Red Knot and transferred them into a climate-controlled aviary. Over the next eight months, all eight birds stayed in sync with their wild and free-living counterparts despite their controlled living conditions and forced flightlessness. The four C. c. islandica molted and lost muscle mass in August, in sync with their free-living counterparts (Dietz et al., 1999, Figure 1b,f). The four C. c. canutus gained weight and flight muscle mass in August, in preparation for an extraordinary migration they wouldn’t undergo, then lost weight and flight muscle mass as they molted in January–April, in sync with their own free-living, migrating counterparts (Dietz et al., 1999, Figure 1a,e). (Click here to return to your regularly scheduled paragraph.)

5. Note that “radio-monitored birds” always implies a small study set. Radio and GPS monitoring is expensive, labor intensive, and introduces a rogue variable in that many birds change their behaviors after being harnessed or otherwise burdened with devices. Fleskes et al. started with 181 radio-tagged female Mallards (p. 208). (Click here to return to your regularly scheduled paragraph, already in progress.)

6. Just an aside about those body weights: 900.3 g ± 30.1 g (mean ± SD). It’s math. Read aloud, the notation says “…a mean weight of 900.3 grams plus or minus a standard deviation of 30.1 grams…”. It essentially means that:

  1. The average weight of these 11 ducks was 900.3 g (1.98 pounds).
  2. But the “…plus or minus a standard deviation of…” part of the notation indicates that anyone who wants to use this number to predict how much any other 11 Mallard hens (captured in the same location, at the same time of year, and in the same nesting stage) might weigh, on average, should expect the prediction to be off by as much as 30.1 g (0.066 pounds).
  3. So, if I want to open a county fair booth and guess the average weight of 11 Mallard hens (in North Dakota, in spring, who are incubating a nest of eggs that should hatch within 5 days), I should note in my fine print that as long as I am within 0.066 pounds of the correct number, I win. Then, as long as I always guess 1.98 pounds, I should win more often than I lose.
  4. BUT, given that this number was derived from only one group of 11 hens in 1981, and given that hundreds and thousands of Mallard hens might simultaneously be incubating a nest of eggs that are within 5 days of hatching, in spring in North Dakota in 2025…? I think I’ll keep plugging away trying to earn a living as a writer and editor, because my I Can Guess the Weight of Your Mallards county fair booth is on shaky statistical ground.
  5. If I jump ahead to Table 1 (p. 31), which reports an average ovarian weight for prelayers of 6.3 ± 8.7, I’m in a different statistical bind. That’s a worrying standard deviation number, because if I take the “plus or minus 8.7” at face value, my Guess the Pre-laying Mallard Hen’s Ovarian Weight county fair booth is going to be a hot mess. In this case, my fine print is going to state that I win if I guess within 8.7 grams of the actual weight. Every time I win after guessing a negative number, an interrobang will randomly manifest in a doctoral thesis from the 1940s (!?). (I can’t speak to what, exactly, produced a standard deviation so large that county fair booths and negative ovarian weights intersected in this footnote. Should any readers have ideas, please comment.)
  6. Click here to return to your regularly scheduled paragraph, already in progress.

7. The Materials and Methods section of this paper is disappointing, as it doesn’t clarify where and how the comparison data were selected. The seven renesting hens were compared to a subset of 10–11 “initial nest” hens (Krapu, 1988, Table 3, p. 35), with no indication of whether these comparison hens were also included in the earlier analyses of hens at various laying stages. A close reading finds the Table 3 initial nest hens defined as hens in “rapid follicular development…pre-ovulating females with ovary weights ≧ 3.0 g” (p. 30), but this status should have applied also to some of the hens labelled as “pre-laying” in the analyses for laying stages. The author notes that 71 female Mallards were slaughtered over the course of this study, but the math doesn’t work. At most, even if I’m counting some of the prelayers twice, I get 19 prelayers + 11 layers + 3 incubators + 11 initial nesters + 7 renesters = 51 hens. Where are the other 20 hens? And why are there three (3!?) data sets of 11 hens here? (11 layers, 11 initial nesters, 11 late-nesting hens weighed and, hopefully, released…). My OCD doth protest. (Click here to return to your regularly scheduled paragraph.)

References

Baker, A., Gonzalez, P., Morrison, R. I. G., & Harrington, B. A. (2020). Red Knot (Calidris canutus). Birds of the World (CornellLab). https://birdsoftheworld.org/bow/species/redkno/cur/systematics

Dietz, M. W., Piersma, T., & Dekinga, A. (1999). Body-building without power training: endogenously regulated pectoral muscle hypertrophy in confined shorebirds. Journal of Experimental Biology 202(20), 2831-2837. doi: 10.1242/jeb.202.20.2831

Dzubin, A. & Gollop, J. B. (1971). Aspects of Mallard breeding ecology in Canadian parkland and grassland. Canadian Wildlife Services. https://publications.gc.ca/collections/collection_2024/eccc/cw66/CW66-1042-1971-eng.pdf

Heitmeyer, M. E. (1988). Body composition of female Mallards in winter in relation to annual cycle events. The Condor 90(3), 669-680. doi: 10.2307/1368357

Fleskes, J. P., Mauser, D. M., Yee, J. L., Blehert, D. S., & Yarris, G. S. (2010). Flightless and post-molt survival and movements of female Mallards molting in Klamath Basin. Waterbirds 33(2), 208-220. doi: 10.1675/063.033.0209

Krapu, G. L. (1981) The role of nutrient reserves in Mallard reproduction. The Auk 98, 29-38. doi: 10.1093/auk/98.1.29

Panek, M. & Majewski, P. (1990). Remex growth and body mass of Mallards during wing moult. The Auk 107, 255-259. doi: 10.2307/4087607

Piersma, T. (1988). Breast muscle atrophy and constraints on foraging during the flightless period of wing moulting Great Crested Grebes. Ardea 76, 96-106.

Portugal, S. J., Green, J. A., & Butler, P. J. (2007). Annual changes in body mass and resting metabolism in captive barnacle geese (Branta leucopsis): the importance of wing moult. Journal of Experimental Biology 210(8), 1391-1397. doi: 10.1241/jeb.004598

Portugal, S. J., Thorpe, S. K. S., Green, J. A., Myatt, J. P., & Butler, P. J. (2009). Testing the use/disuse hypothesis: pectoral and leg muscle changes in captive barnacle geese Branta leucopsis during wing molt. Journal of Experimental Biology 212, 2403-2410. doi: 10.1242/jeb.021774

Focusing on Mallards, Part II

Content warning: This blog post contains references to the hunting, agriculture, and research practices of killing birds. If you choose not to read on, I respect and admire your choice.

Part of my purpose in writing this Mallard series is to highlight the price that has been paid (and continues to be paid) for the knowledge we have about Mallards and other birds. I might have constructed these posts, as a younger writer, without acknowledging the deaths behind the data. But as I’ve aged, I’ve grown more aware of the cost of knowledge.

In this photo, the Mallard hen who inspired this series of blog posts swims with her brood of day-old ducklings in our dragonfly pond.
In this photo, the Mallard hen who inspired this series of blog posts swims with her brood of day-old ducklings in our dragonfly pond. The ducklings are gathered around a grassy seed head that the hen tugged down to within their reach. The hen nested in our neighbor’s yard, during spring 2024, and brought her brood to the dragonfly pond the morning after they hatched and again the next day. I wondered, during and after her long inactivity on the nest, if she experienced the kind of changes in muscle mass that I might experience if I spent most of a month in bed. I didn’t find a good answer for that question, but I found adjacent answers to adjacent questions. Enough adjacent questions and answers for this multi-part blog post.

What I mean by “knowledge”

It’s one thing, for me, to observe our yard and its visitors. To slip away from human concerns and simply watch. To sate myself with wonder. These hours shift my perspective. They build new connections between old memories. I sometimes emerge with splintered metaphors to sand and patch and paint. Sometimes with fine-grained phrases that liven up a drab idea. On the rarest and best days, I emerge with blueprints for new knowledge.

Observation and wonder are one thing. But knowledge is an entirely different state.

Separate and distinct from the metaphysical implications of knowing, my definition of knowledge is an inventory of education and experience. The nouns of my past and the context in which I encountered them, indexed by subject and era. A cross-referenced heap of biology, shuffled around the edges with chemistry. A shelf of style guides and writing advice. A few notebooks of math, physics, and cosmology. A faded box of recipes, crochet patterns, and needlework hints. Stacks of genre reading. Great aisles of emptiness where business, economics, and law failed to catch my interest.

I was recently asked to list my areas of expertise. I wanted to respond that I have none. I am a worksite traced with utility locator flags, not a finished library. I might claim my main parlor, biology, but even there the framework is incomplete. And, to align the metaphor with my theme, construction materials are expensive.

For many long decades I failed to appreciate the cost of knowledge, with its scaffolds of data. In this post, I’ve chosen to pull back the curtain I so blithely ignored as a young science student. Much of what I find behind that curtain forces me to stock those great empty aisles of business, economics, and law. Because the dimly-lit ledger of science history, written mostly by rich old white men, seldom accounts for cost. But every so often, jotted in the margins or tucked between the pages, the writers left remnants of their invoices.

In this photo, sleepy Mallard ducklings bask on a sun-warmed rock beside our dragonfly pond. One of the ducklings is yawning. From many perspectives, these ducklings are resources to be managed and controlled. For me, here in my middle years, these ducklings are downy singularities of wonder and charm far more valuable than mere resources.

The capitalism behind the curtain

During my brief foray in the humanities silo, I chafed over intense criticisms of science and science writing. But I couldn’t deny the foundational weakness. Science motored along for centuries, impervious to criticism, fueled by colonialism and capitalism. For the most part, it still does.

What would it look like, if science and science writing discarded the curtain and directly acknowledged the capitalism? The colonialism? Not just here and there, but in every published report? If the ledger was complete and brightly lit?

I don’t expect a humanities-approved (and strengthened) science literature would look like anything I can imagine. I am neither scientist nor science writer. What’s more, my little graduate certificate in professional writing is not a stamp of humanities approval. So I can’t answer the questions that followed me home from the humanities silo.

But I am an avid science consumer. As such, the word cost is not chosen lightly. Whenever I look behind the curtain of knowledge, no matter the era or discipline, I find the busy (and visible) hands of capitalism.

As ubiquitous as hunger, questions are free for anyone who has the energy and time to ask them. But answers? Answers are capital. They are expensive. And, weighed in the hands of capitalism, answers are expected to reap a profit.

What happens when answers are not synonymous with capital gain? When hunger lingers or multiplies because the investment outweighs the return? In very short order, the hands of capitalism divert resources and time toward less costly questions and more profitable answers. Or, at least, toward questions perceived to be less costly and answers anticipated to be more profitable. The question I should have been asking for years, the question I am asking now, is this: Whose perceptions and anticipations control the resources?

In this photo, a day-old duckling stretches upward to sample a mostly bald dandelion head. During their brief time in the yard, the ducklings stripped all the seeds from all the dandelions within several feet of the pond. I don't know if they ate the seeds or merely pulled them off as part of their exploration process
In this photo, a day-old duckling stretches upward to sample a mostly bald dandelion head. During their brief time in the yard, the ducklings stripped all the seeds from all the dandelions within several feet of the pond. I don’t know if they ate the seeds or merely pulled them off as part of their exploration process.

Some practicalities about Mallards and other waterfowl

Historically, Mallards had value (and have value, still) because they were and are hunted and farmed. When it comes to funding research, and to collecting data for research, hunted and farmed species are valuable, easy resources. “Valuable” in the capitalist sense of being actual capital, but also in the academic sense of data. “Easy” because these species live and die in larger, more accessible numbers than similar species that are neither hunted nor farmed.

Hunted waterfowl (and other game birds) live and die in their large numbers within easy reach of researchers. I can’t write a path around the pragmatism of this system, but I am increasingly uncomfortable with such pragmatism.

As capital, a Mallard’s value is tethered to its food and sport potential. Driven by this food and sport value, research funding adds further value to a Mallard. Each bird is data. Whether hunted, farmed, or recorded into a set of measurements, a Mallard’s value peaks with its death. (Perhaps this is true of every individual, of every species, but I’ll leave that notion for a later post.)

What of this spring’s next-yard hen, with her downy brood? When I perceive them as more than units of capital, when I anticipate their ongoing existence as more than a value that peaks when they die, my ability (and desire) to control them as resources wanes. For me, this feels like a good and useful adjustment of my perceived and anticipated place in the world.

The older I get, the less comfortable I am with capitalism and its pragmatisms. Far from being an agriculture, research, or policy pragmatist, I want the next-door hen and her offspring to have an embodied value separate from their muscle mass and plumage. I want empathy to count. My still and quiet moments in the yard. The silly antics of ducklings in a dragonfly pond. The charm of infant proportions and curious hungers. I want to measure value as a sense of shared life, a shared world, and shared safety or peril.

Photo of the next-yard Mallard hen sleeping at the edge of the dragonfly pond. She is asleep standing up, the equivalent of a duck cat-nap, beak tucked under the feathers of her wing. Her babies are nestled in her shadow, all except one duckling that has edged out onto the warm rocks in the warm sunlight.

Aside: the literature’s euphemisms for “kill”

According to Google’s default dictionary, the word euphemism is derived from the Greek roots eu-, meaning “well”, and -phēmē, meaning “speaking”. I was taught, somewhere in my education, to translate euphemism as good word. But in my more recent years I have come to view euphemisms as veiled words. Intentional deflections. Syntactical high ground for writers (and researchers?) who wish to describe expanses of quicksand without getting mired. I sympathize with the impulse to build polite nomenclatures. To write around shock words and trauma words. But we’re all in the quicksand, no matter what we write.

(Remember the opening content warning? I do understand the need, the profound and pressing need, to protect victims of shock and trauma from experiencing further shock and trauma. This is why I embrace the practice of content warnings. The remainder of this blog post contains frequent references to the research, agriculture, and hunting practices of killing birds. If you choose not to read on, I respect and admire your choice.)

Policy, agriculture, and hunting literatures shy from the words kill and slaughter. “Kill” is rather imprecise, I suppose, for research literature. And “slaughter” is a bloody word, even with its Merriam-Webster finesse—“the butchering of livestock for meat”. In that sense, I acknowledge that “slaughter” is imprecise, as well. The birds (including Mallards) that populate policy, agriculture, and hunting literatures are resources. They are capital and data, not meat. Does it matter how we describe their deaths? (Yes! Of course it does.)

In the literatures, birds (including Mallards) are hunted, shot, collected, harvested, culled, sacrificed, and euthanized. Dead birds are examined, necropsied, and sampled. Wings are placed in the mail.

For this post and its subsequent parts (I’m not certain how many parts there will be), I’m choosing the word slaughter. Because I added up the numbers behind the data. The research numbers in the tiny subset of articles referenced here run into the thousands. The hunting numbers, hundreds of thousands per year. I feel the word slaughter fits.

The rest of my multi-part Mallard post draws heavily from work done by and for the research, agriculture, and hunting industries. Birds died for these questions and answers. For better or for worse, this is the world we have shaped for Mallards and their avian kin.

In this photo, a day-old Mallard duckling sleeps in a patch of clover and grass at the foot of one of the stones lining our dragonfly pond. The duckling is slumped forward, having nodded off after slipping down from the stone where most of its siblings were sleeping. Other siblings have slipped off of the stone, too, and are nodding off in a stair-step heap behind the sleeping duckling.

The research numbers

The following section, which deals with variations in the relative sizes of flight muscles, leans heavily on an article by D. C. Deeming, PhD.: “Allometry of the pectoral flight muscles in birds: Flight style is related to variability in the mass of the supracoracoideus muscle.” Deeming’s article pulled data from three primary sources: two tracts (1961 and 1962) from the Smithsonian Miscellaneous Collections and a 2016 survey out of Romania.

  1. Greenewalt, C. H. (1962). Dimensional relationships for flying animals. Smithsonian Miscellaneous Collections 144(2).
    • Greenewalt collated pectoral muscle weights from a 1922 French publication: Magnan, A. (1922). Les caractéristiques des oiseaux suivant le mode de vol. Annales des sciences naturelles, Series 10, Volume 5, 125-334. (Yes, that is the same Antoine Magnan responsible for the urban legend that bees should be mathematically incapable of flight.) Magnan’s work used captive birds and, as Greenewalt cited, “…those which appear to be in bad health were discarded” (Greenewalt, 40). Some 228 birds, representing about 223 species, were slaughtered for this data. (I’m hedging my numbers because counting=math=possibility of error.)
  2. Hartman, Frank A. (1961). Locomotor mechanisms of birds. Smithsonian Miscellaneous Collections 143(1).
    • Hartman’s tract drew from more ambitious work that took place in Florida, Maine, Ohio, and Panama. Birds were “collected” (or, even more euphemistically, “obtained”) from January to March, mostly before 11 AM (p. 3). The method of collection isn’t specified, nor the method of slaughter, though the authors specify that birds and their dissected muscles were weighed in “fresh condition” (p. 2). The pages and pages of data (pp. 38-91) represent more than 360 species. Individual numbers range from 1 (i.e., a solitary Bicolored Hawk of unknown sex and a single male Ruddy-capped Nightingale Thrush) to 50 or more (i.e., 55 House Sparrows, 51 White-breasted Nuthatches, 52 Rufous-tailed Hummingbirds, 50 Smooth-billed Anis, and 103 Brown Pelicans). In total, more than 6000 birds. (Again, hedging because math.)
  3. Vágási, C. I., Pap, P. L., Vincze, O., Osváth, G., Erritzøe, J., & Møller, A. P. (2016). Morphological adaptations to migration in birds. Evolutionary Biology 43, 48-59.
    • Vágási et al. captured and banded live birds in Romania, but also “[c]arcasses from natural deaths (e.g. road kill, building collision, electrocution, starvation) were collected in Romania and Denmark for taxidermy” (p. 50). The authors clarify, “Numerous bird specimens were brought frozen to JE, more than 95% of them being found dead and the remaining were shot by hunters” (p. 51). The dataset, here, includes some 115 species. Sample sizes ranged from single individuals (i.e., one Grey Wagtail , one Peregrine Falcon, and one Whinchat) to more than 100 (i.e., 824 House Sparrows, 228 Eurasian Blackbirds, and 193 Eurasian Sparrowhawks). In total, more than 3800 birds. (This article models a practical and effective approach to science without fresh slaughter, primarily sourcing data from carcasses submitted for the study. Granted, “natural deaths” from road kill, building collision, and electrocution are hardly “natural”, but I appreciate the distinction between carcass repurposing and the slaughter of otherwise healthy birds for research purposes.)

So Deeming gleaned data from more than 10,000 birds, without listing a single slaughter in the Materials and Methods section. This is both efficient science and inefficient communication. The actual numbers were curtained off, in at least one case, two sources deep and a century back. I applaud the reuse of data, but I resent the legwork required to find the birds within the data.

I expect that most of The Journal of Zoology‘s readers feel no need to find the birds. After all, the article’s intended audiences hold greater and deeper knowledge of birds, wings, and flight than I bring to the moment. The author and intended audiences would likely characterize my stroll down the numbers rabbit-hole as a tangent prompted by unrealistic purposes and fueled by OCD. But, was it?

What is the capital, here? Or rather, which capital is more valuable? The answers and knowledge, so satisfactory to my passing curiosity? The data and findings, so neatly packaged for future reference? Or the birds themselves, so fleetingly alive?

Ask a different me, in a different era, and my response to these questions would change. But, for now, my heart yearns toward the birds so fitted for flight as to seem almost magical, winging through yards and migrating over landscapes and dabbling with their downy chicks in dragonfly ponds.

In this photo, the Mallard hen reaches up to strip seeds from an overhanging, overgrown, and unknown species of grass that was growing around the foot of the dragonfly pond. The hen is floating in the pond surrounded by her day-old brood.
Here, the Mallard hen has pulled the overhanging grass down toward her day-old ducklings. One of the ducklings is looking up from its place floating in front of her in the dragonfly pond, waiting for her to pull the grass low enough for the ducklings to sample the seeds.

Variation in the relative masses/sizes of flight muscles

(For specifics of flight muscle anatomy, see Part I of this post. In short, two muscles power bird flight: the large pectoralis muscle, which powers a wing’s downstroke, and the smaller supracoracoideus muscle, which powers a wing’s upstroke. Both muscles stretch across birds’ chests, from wing to sternum. If you eat poultry, these flight muscles are the breast meat.)

An average bird with average flying habits pushes down against air with its downstroke muscle, wing extended and feathers angled to maximize (or to finesse) the lift. How much force is needed depends on the birds’ weight and acceleration. Is it a heavy-bodied duck or a sleek-framed crow? At a minimum, the downstroke muscle is massive enough to lift the bird’s weight against gravity and accelerate according to the bird’s habits. Imagine the initial heaves of a Mallard taking flight. The lazy hop-launch of a crow. Which bird has bulkier downstroke muscles?

Back to the average bird with average flying habits, downstroke accomplished. Now it tucks and rotates its wings, to minimize air resistance for the upstroke.

Push (PUSH) down. Tuck. Pull (pull) up. Flap. Flap.

Large downstroke muscle, for the heavy work of lifting body weight against gravity. Much smaller upstroke muscle, lifting only the weight and feather-drag of tucked and rotated wings against air. Whether Mallard or crow, the upstroke muscle does less work. (Read on for exceptions, because there are always exceptions.)

In average birds with average wings, downstroke muscles are between 8 and 13 times larger than upstroke muscles (Deeming, “Discussion”, para. 1). So much pushing, so little pulling.

But what about not-average birds? What about birds with exceptional flight habits? What about flightless birds?

Some birds need to pull (PULL) as they raise their wings. They need a mightier upstroke muscle. Penguins, auks, and many other diving birds use their wings under water. No matter how much they tuck and rotate, water isn’t air. There’s more drag. These birds’ upstroke muscles are large, both in proportion to their downstroke muscles and in proportion to their body sizes. Their downstroke muscles are still the largest flight muscle, but only about 1 to 3 times larger than the upsized upstroke muscle. No more of those 8 and 13 numbers (Deeming, “Discussion”, para. 2).

Hummingbirds, which actually rotate and invert their wings during the upstroke, generate lift in both phases of the flap: push (PUSH) and pull (PULL). Surprisingly, to me, pigeons also generate lift in the upstroke, via a trick of the wing tip to change their wing shape. Both hummingbirds and pigeons measure in the same range as diving birds that swim with their wings; their downstroke muscles are only 1 to 3 times larger than their upstroke muscles (Deeming, “Discussion”, para. 2 & para. 5).

More special conditions occur for flightless birds, such as Rheas, and for owls and hawks. More special distributions of muscle. The Deeming article is packed with details.

I didn’t mean to write this much. But I’m fascinated. And I have OCD. It’s a dangerous combination, where tangents are concerned. But in the next part of this post, I’ll move on to flight muscle changes during a bird’s life cycle, as there is plenty of evidence regarding changes in flight muscle mass during molt.

Photo of a Mallard hen walking through the mown grass and weeds that make up our back yard. She is followed by her day-old brood of nine. Here, they were beginning their first stroll away from our tame-ish yard, toward the big waters running through our Tidewater area.
Photo of the Mallard hen walking through the mown grass and weeds that make up our back yard. She is followed by her day-old brood of nine. Here, they were beginning their first stroll away from our tame-ish yard, toward the big waters running through our Tidewater area.

Publication Announcement!

If you’re still here, I very much appreciate your time and attention. And, while I do feel a pang of irony as I promote my own writing while complaining about capitalism, my second poetry collection is now available!

Alchemy (Kelsay Books, 2024)

Photo of the front cover of Alchemy, which features trinkets and jewelry (many passed down from my mother) arranged on a cloth background. Each broach, bracelet, pendant, earring, and trinket illustrates a theme or topic from the poetry. Featured in the center, a Noah's ark pin and a globe-and-animals pin are connected by an antique miniature watch on a chain. Other items show mammals, birds, insects, fish, reptiles, amphibians, plants, and a fossilized seashell. Text on the cover reads "Alchemy, poems, Rae Spencer".
Photo of the front cover of Alchemy, which features trinkets and jewelry (many passed down from my mother) arranged on a cloth background. Each broach, bracelet, pendant, earring, and trinket illustrates a theme or topic from the poetry. Featured in the center, a Noah’s ark pin and a globe-and-animals pin are connected by an antique miniature watch on a chain. Other items show mammals, birds, insects, fish, reptiles, amphibians, plants, and a fossilized seashell. Text on the cover reads “Alchemy, poems, Rae Spencer”.

Alchemy is a different kind of collection than my previous Watershed. The poems in Alchemy are arranged in five sections after the style of academic articles: Introduction, Methodologies, Results, Discussion, and Conclusion. The poems celebrate my fascination with science and the history of science, but also express my yearning for the kind of metaphysical knowing I referenced earlier in this post. I hope readers feel their own celebrations and yearnings, as they read. Alchemy is available in paperback ($20) from Kelsay Books and in paperback ($20) or Kindle ebook ($9.99) from Amazon.


References

Deeming, D. C. (2023). Allometry of the pectoral flight muscles in birds: Flight style is related to variability in the mass of the supracoracoideus muscle. Journal of Zoology 319(4), 264-273. https://doi.org/10.1111/jzo.13043

Greenewalt, C. H. (1962). Dimensional relationships for flying animals. Smithsonian Miscellaneous Collections Vol 144(2).

Hartman, F. A. (1961). Locomotor mechanisms of birds. Smithsonian Miscellaneous Collections Vol 143(1).

Vágási, C. I., Pap, P. L., Vincze, O., Osváth, G., Erritzøe, J., & Møller, A. P. (2016). Morphological adaptations to migration in birds. Evolutionary Biology 43, 48-59. https://doi.1007/s11692-015-9349-0

A Post about Coronaviruses

Something has been bothering me for a while, which means this post has been brewing for a while. (It’s also been edited a few times, since posting. Mostly in this introductory section, where I’ve cut and rearranged because the first version had too many words and asides.)

I’m going to talk about coronaviruses.

Marie and Duchess sitting on a carpeted floor, looking up at the camera. Marie is a pale gray watermarked tabby cat. Duchess is a pale gray and orange tortoiseshell cat with a clipped left ear.

This post is a departure for me. In talking/writing about coronaviruses on this blog, I’m breaching the barrier between my two worlds. Between my relaxing world of creativity, where I indulge myself with poetry and photos and blog posts, and my anxious world of responsibilities, where I worry about knowledge and knowledge gaps and the idea that facts about the natural world exist but are seldom fully grasped.

In my anxious world of responsibilities, I’ve been talking about coronaviruses for much of the past year. But only with friends and family. And cats. Marie and Dutch are attentive listeners.

Sometimes.

Marie, a pale gray watermarked tabby cat, is looking out of the window from her perch on a flannel blanket at the foot of a bed. Duchess, a pale gray and orange tortoiseshell cat, is sprawled in her back, yawning, in a chair in front of the window.

Actually, they’re not very good listeners at all.

Two cats, Marie and Duchess, are sitting on a carpeted floor, looking into their wire and canvas expandable play tunnels. One tunnel is green, the other is blue. Their heads and shoulders are fully inside the tunnels, so only their backs and tails are visible.

Moving on…

Two cats, Marie and Duchess, are sitting on a red mat, backs to the camera, looking out of a door that has windowpanes extending almost to the floor.

In this post, I’m going to explain some of what I know about feline coronavirus. Then I’m going to explain why I’ve been talking to my friends and family and cats about feline coronavirus during the COVID-19 pandemic.

Part I

The coronavirus family tree

To be clear, feline coronavirus is a distinctly different virus from COVID-19.

Taxonomically, both feline coronavirus and COVID-19 belong to the subfamily orthocoronavirinae (previously called coronavirinae), but they are in different genera. COVID-19 is in the genus betacoronavirus, while feline coronavirus is in the genus alphacoronavirus.

But what do these classifications mean? Obviously, they mean that feline coronavirus and COVID-19 are somewhat related, but does “somewhat related” mean anything useful for bloggers and readers and cats?

Two cats, Marie and Duchess, are looking at the camera while sitting on a gray desk chair that is in front of a white desk. The desk is stacked with papers and a spiral notebook. Marie is a pale gray watermarked tabby cat. Duchess is a pale gray and orange tortoiseshell cat with a clipped left ear.

A linguist might say It depends on what you mean by ‘useful.’ An editor might say The question needs editing before it can be answerable. And a taxonomist would likely say Please stop before you even start, because viral taxonomy follows its own rules and should not be compared to cats.

Two cats, Marie and Duchess, are sitting on a gray blanket with their backs to the camera, looking out of a window. Both have their front feet on the window sill. The tension in their bodies indicates that they are very interested in whatever is off-camera, outside the window.

The history of the taxonomy, classification, and nomenclature of viruses is an interesting study of its own. Efforts to classify viruses began in the 1960s and continue today, with a major expansion of the classification system having been proposed as recently as 2017. Currently, the family tree of coronaviruses looks something like this (Decaro & Lorusso 2020; Kipar & Meli, 2014):

  • Order – Nidovirales
    • Family – coronaviridae
      • Subfamily – coronavirinae (as of 2014) or orthocoronavirinae (as of 2020)
        • Genus – alphacoronavirus, betacoronavirus, deltacoronavirus, and gammacoronavirus

Beyond the genus level of classification, the coronavirus family tree branches into subgenera, species, and subspecies, with some 39 species of coronaviruses distributed across 27 subgenera (Coronaviridae Study Group of the International Committee on Taxonomy of Viruses, 2020).

But again, what do these classifications mean?

In a desperate and thoroughly unscientific attempt to answer this question, I’m borrowing an example from mammalian taxonomy. (Remember the taxonomist’s warning, that viral taxonomy should not be compared to cats? Like I said, the following comparison is thoroughly unscientific. I’ll understand if the taxonomist, or any other reader, snorts in contempt and walks away.)

Two cats, Marie and Duchess, are sleeping together in a cat bed in front of a window. The cat bed is slightly too small for both of them to fit comfortably, so they look slightly uncomfortable. Beside them, there is a second cat bed, which is empty.

In viral taxonomy, feline coronavirus and COVID-19 are in the same subfamily, but in different genera.

In mammalian taxonomy, domestic cats and bobcats are in the same subfamily, but in different genera.

The feline family tree

Dutch and Marie are domestic cats. Spoiled, pampered, much loved house cats.

Two cats, Marie and Duchess, are curled up together on a brightly colored blanket on the floor in front of a glass door. Their backs are to the camera, and they are looking outside.

Taxonomically speaking, Dutch and Marie belong in subfamily Felinae, the genus Felis, and the species catus. Put in the more familiar binomial phrasing of genus-species, Dutch and Marie are Felis catus. By comparison, bobcats also belong to the subfamily Felinae, but are classified in the genus Lynx and species rufus. So, binomially, bobcats are Lynx rufus.

To add a third, and somewhat more complicated, data point (because everything is complicated in taxonomy), Pallas’s cats are also classified in the subfamily Felinae. But some sources place Pallas’s cats in the genus Felis and other sources separate them into the genus Otocolobus. All seem to agree on a species name for Pallas’s cats–manul. So Pallas’s cats are variously listed as Felis manulOtocolobus manul, or Felis (Otocolobus) manul.

Marie and Dutch, being pair-bonded rescue Felis catus, are clearly related to each other. Littermates, maybe. But they are only distantly related to bobcats and Pallas’s cats. Some taxonomists, those who classify Pallas’s cats in the genus Felis, might consider Marie and Dutch more closely related to Pallas’s cats than they are to bobcats. Other taxonomists, those who classify Pallas’s cats in the genus Otocolobus, might consider Marie and Dutch no more closely related to Pallas’s cats than they are to bobcats. For my purposes, it is enough to note that domestic cats, bobcats, and Pallas’s cats are all cats, but they are all distinctly different cats.

A gray cat, Duchess, is mostly hidden in a brown polka-dot cat bed with tall sides. All that can be seen over the sides of the bed are her ears and one hind foot extended over the bed's side, toward the camera. The pads of her foot are visible.

Feline coronavirus and COVID-19 are both coronaviruses, but they are distinctly different coronaviruses.

(Back to the taxonomist’s concerns: Viral taxonomy and mammalian taxonomy are, indeed, different systems. The above comparison is flagrantly unscientific. I offer it as a metaphorical demonstration of the messiness inherent in trying to describe, measure, or quantify relatedness among viruses and/or cats.)

A gray cat, Marie, is mostly hidden under a black sheet and white blanket. All that can be seen is her nose and part of one eye, along with a few toes of one front foot. Her position and tension indicate that she is stalking something from her hiding place under the sheet and blanket.

Part II

As recently as the early 1990s, when I first entered veterinary school, there were many knowledge gaps in the story of feline coronavirus. Now research has illuminated how the virus moves within cat populations and has unraveled some of the complex mechanisms that mediate how the virus affects individual cats.

From here, for the sake of brevity and clarity, I’m going to shorten “feline coronavirus” to FCoV. For one thing, I won’t have to keep typing the whole name. For another, I want to be as clear as possible that coronaviruses are a large and varied group of viruses, while FCoV is a very specific coronavirus that infects cats. Probably even Marie and Dutch, at some point in their lives.

Two cats, Marie and Duchess, are looking at the camera from their positions curled up together in a gray checked cat bed. They were asleep together and just woke up. Their expressions indicate they are interested in the camera.

Yes, even you, my dears. But it’s okay, because the overwhelming majority of cats that become infected with FCoV will have few or no symptoms. Perhaps some diarrhea or other gastrointestinal signs, perhaps some upper respiratory congestion.

(There’s more to the FCoV story, which I’ll come to later. For now, I’ll simply say that I’m grateful Marie and Dutch are among the overwhelming majority of cats who have avoided the “more” part of the FCoV story.)

Two pale gray cats, Marie and Duchess, are sleeping facing each other. Duchess has one front foot wrapped over Marie's neck, and Marie has both front feet propped on Duchess's chest. They are in front of a window, and grass is visible in the background.

Marie and Dutch have likely been infected with FCoV, perhaps on multiple occasions. Because FCoV is “worldwide and ubiquitous among virtually all cat populations”, found in more than 60% of pet cats in multi-cat households and in as many as 90% of kittens in shelters (Pedersen, 2009, p. 227).

FCoV is a single-stranded RNA virus

The particular feature of FCoV that is important to this post, and that has been important in my year-long discussions with friends and family, relates to the way coronaviruses carry their genetic information. Unlike humans and cats (and most other organisms), who carry their genetic information as double strands of DNA, coronaviruses carry their genetic information as single strands of RNA. So FCoV, like all other coronaviruses, employs single-stranded RNA as the primary molecule for carrying genetic information.

Dutch and Marie always go to sleep at this point. It’s okay if you do, too. I’ve fallen asleep several times, myself. But there is a point to this post. I’m getting close to it, and my next tangent about the differences between double-stranded DNA and single-stranded RNA will get even closer.

Two gray cats, Marie and Duchess, are sleeping nose-to-nose curled up together on blanket. The camera is very close to their heads, so their ears are prominently visible.

The double helix packaging of DNA provides a relatively stable structure for passing along genetic information. Each strand of DNA serves as a sort of back-up copy for its partner strand, and the process of DNA copying actually uses this back-up feature to proofread and correct mistakes. Should a strand of DNA break, or should mistakes occur in copying a strand, the back-up copy allows enzymes to repair the breaks and remedy the mistakes. This prevents mutations. Obviously, some mutations slip through, but at a far lower rate than would otherwise occur.

Single strands of RNA are less stable genetic carriers than double-stranded DNA. RNA is a more fragile molecule than DNA, and single-stranded RNA, lacking partner strands, has no back-up copies for enzymatic proofreading. Coronaviruses do have a unique mechanism for proofreading, a complex of enzymes and proteins that proofread key genes (Robson et al., 2020), and this unique mechanism provides some stability. But rapid and frequent mutations still occur.

As a single-stranded RNA virus, FCoV does a poor job of creating exact copies of itself. Every time FCoV copies itself, errors occur. Every time (Kipar & Meli, 2014, p. 507). For that matter, FCoV mutates so often that researchers characterize the array of viruses produced in the course of a single infection as a quasispecies–a group of “related genotypes” (Kipar & Meli, 2014, p. 507). Other researchers use the term “pseudo-strain” (Emmler et al., 2020, p. 792).

In short, within any FCoV infected cat, there are many mutated versions of the FCoV they originally contracted.

Two gray cats are snuggled together in front of a window. The camera is very close. Marie is sleeping with her forehead pressed against Duchess's back. Marie's nose and whiskers are visible. Duchess has her back to the camera and has fallen asleep while looking out of the window.

FCoV and feline infectious peritonitis

The overwhelming majority of cats that become infected with FCoV will have few or no symptoms. Perhaps some diarrhea or other gastrointestinal signs, perhaps some upper respiratory congestion. But there’s more to the story.

For somewhere between about 1% (Pedersen et al., 2012, p. 20) and 12% (Addie et al., 2009, p. 594) of infected cats, their particular FCoV quasispecies mutates into one of a number of forms that are able to cause a devastating and often fatal disease: feline infectious peritonitis (FIP).

I say “able to cause” because the FIP-able quasispecies do not always cause FIP. Some cats can resist FIP, even when their FCoV infection mutates into a form capable of causing FIP. Some cats are resistant at one point in their lives and later become susceptible, others perhaps follow an opposite path. In essence, FIP occurs at intersections between rapidly mutating FCoV quasispecies and the genetics and immune systems of individual cats. When an FCoV quasispecies gains the ability to cause FIP, in a cat that never had or has lost the ability to resist FIP, a deadly cascade of disease may begin.

What I’ve just described is the internal mutation theory of FIP. Put bluntly, this theory says that every case (or cluster of cases) of FIP represents a newly mutated variant of FCoV that is newly capable of causing FIP.

And now, all tangents complete, I come to the point of this post.

Two gray cats, Marie and Duchess, are stretched out together on a blue tie-dyed blanket in front of a window. Marie is asleep with her front feet extended, and Duchess is almost asleep, holding her head up, still, but her eyes are closed.

FIP is not rare.

  • As of 2008, FIP was “one of the leading infectious causes of death among young cats from shelters and catteries” (Pedersen, 2009, p. 225).
  • “In one study, FIP was the most common single cause of disease in cats younger than 2 years of age…. An average of 1-5% of young cattery or shelter cats in the US will die from FIP, with losses in catteries higher than from shelters” (Pedersen, 2009, p. 227).
  • “Up to 12% of FCoV-infected cats may succumb to FIP, with stress predisposing to the development of disease” (Addie et al., 2009, p. 594).

This is the source of my bother. (Remember the bother, all those paragraphs ago, that started this post?)

What does it all mean?

I haven’t found much information about the mutation rates of COVID-19. I feel like the data exists, at least in some rough estimate, but I’ve not found it in a reliable and readily accessible format. And, without ready access to the mutation rates of COVID-19, my frame of reference reverts to my existing knowledge about FCoV.

Two cats are silhouetted in front of a screened window. Both cats have their backs to the camera and are looking with interest at something outside the window. Grass is visible outside.

FCoV and COVID-19 are only distantly related, but all coronaviruses share the genetic instability that comes from having a single-stranded RNA genome. Yes, coronaviruses have a unique mechanism for some stability, but this mechanism can’t completely compensate for the instability that leads to mutations.

A vague measure of the instability of FCoV can be seen in the incidence of FIP in cats around the world. Because each case (or cluster of cases) of FIP represents an FCoV quasispecies that has newly acquired one or more of the mutations that enable FIP.

Remember those word problems in math class?

  1. Think about how many kittens and young cats there are in the world. (While no one counts the number of kittens born each year, the ASPCA estimates that 3.2 million cats enter US animal shelters each year…)
  2. Narrow the number down to all the kittens and young cats in shelters and multi-cat environments, each year. (Hint: That’s still so very many cats.)
  3. Between 60% and 90% of the cats in shelters or in multi-cat environments will, at some point, become infected with FCoV.
  4. Calculate a number that would be between 1% and 12% of FCoV-infected kittens and young cats.

That’s how many cats will develop FIP each year.

According to the internal mutation theory, that’s how many times FCoV mutates, each year, into a form capable of causing FIP in a cat that is incapable of resisting FIP. (To determine the exact number of times FCoV mutates into a form capable of causing FIP, add the times such mutations occur in a resistant cat.)

As a word problem, the math itself is not too complicated. The scope of the problem is obvious, even without exact numbers.

Limiting the emergence of variants is the point

The incidence of FIP represents a direct measure of how often one specific group of FCoV variants emerge in cats. Each case (or cluster of cases) of FIP represents a newly mutated variant of FCoV that is newly capable of causing FIP. And FIP is not rare.

I’ve spent the last year lecturing my family and friends and cats about the mutation rate of FCoV, pleading for everyone to do as much as possible to limit COVID-19’s infection cycles.

Yes, it’s true that FCoV and COVID-19 are only distantly related. (Metaphorically, about as distantly related as domestic cats are to bobcats.) But if the mutation rate of COVID-19 is even a fraction of what is seen with FCoV, the risk of new variants surges with each surge of infections.

While it is scientifically inaccurate and somewhat irresponsible to claim that more dangerous COVID-19 variants are inevitable if infections continue, it is equally inaccurate and irresponsible to claim that more dangerous variants are impossible. This, also, is the point.

A slightly overweight cat (sorry, Duchess, but it's true) is standing on her hind legs with her front feet braced against a closed window. She is silhouetted, and grass, shrubbery, and a wooden fence are visible outside.

P.S. Marie and Duchess (Dutch) would like me to add that they are very good listeners, all the time. It’s just that they prefer listening to things other than my voice.


References:

Addie, D., Belák, S., Boucraut-Baralon, C. Egberink, H., Frymus, T., Gruffydd-Jones, T., Hartmann, K., Hosie, M. J., Lloret, A., Lutz, H., Marsilio, F., Pennisi, M. G., Radford, A. D., Thiry, E., Truyen, U., & Horzinek, M. C. (2009). Feline infectious peritonitis: ABCD guidelines on prevention and management. Journal of Feline Medicine and Surgery 11, 594-604. doi: 10.1016/j.jfms.2009.05.08

Coronaviridae Study Group of the International Committee on Taxonomy of Viruses (2020). The species Severe acute respiratory syndrome-related coronavirus: classifying 2019-nCoV and naming it SARS-CoV-2. Nature Microbiology 5, 536-544. https://doi.org/10.1038/s41564-020-0695-z

Decaro, N. & Lorusso, A. (2020). Novel human coronaviruses (SARS-CoV-2): A lesson from animal coronaviruses. Veterinary Microbiology 244(2020). 1-18. doi: 10.1016/j.vetmic.2020.108693

Emmler, L., Felten, S., Matiasek, K., Balzer, H.-J., Pantchev, N., Leutenegger, C., & Hartmann, K. (2020) Feline coronavirus with and without spike gene mutations detected by real-time RT-PCRs in cats with feline infectious peritonitis. Journal of Feline Medicine and Surgery 22(8). 791-799. doi: 10.1177/1098612X19886671

Kipar, A. & Meli, M. L. (2014). Feline infectious peritonitis: Still an enigma? Veterinary Pathology 51(2). 505-526. doi: 10.1177/0300985814522077

Pedersen, N. C. (2009). A review of feline infectious peritonitis virus infection: 1963-2008. Journal of Feline Medicine and Surgery 11. 225-258. doi: 10.1016/j.jfms.2008.09.008.

Pedersen, N. C., Liu, H., Scarlett, J., Leutenegger, C. M., Golovko, L., Kennedy, H., & Kamal, F. M. (2012). Feline infectious peritonitis: Role of the feline coronavirus 3c gene in intestinal tropism and pathogenicity based upon isolates from resident and adopted shelter cats. Virus Research 165, 17-28. doi: 10.1016/j.virusres.2011.12.020

Robson, F., Khan, K. S., Le, T. K., Paris, C., Demirbag, S., Barfuss, P., Rocchi, P., & Ng, W.-L. (2020). Coronavirus RNA proofreading: Molecular basis and therapeutic targeting. Molecular Cell 79, 710-727. https://doi.org/10.1016/j.molcel.2020.07.027

A Deer in the Suburbs and a Science Major in the Humanities

We live in the suburbs. In the most suburban of suburbs. Our house sits in the end of a cul-de-sac within easy walking distance of two schools, three strip malls, an embarrassment of restaurants, a clamor of gas stations, a smallish city park, and a pair of naval bases.

Suburbia hasn’t overrun all of the fields in our area, nor every wooded lot, but there’s nothing that resembles a wilderness corridor. So the young stag that landed in our yard, in October of 2019, had scrambled across miles of sidewalks and pavement before getting trapped in our cul-de-sac and scraping over our fence.

Only to find more fence, on the other side.
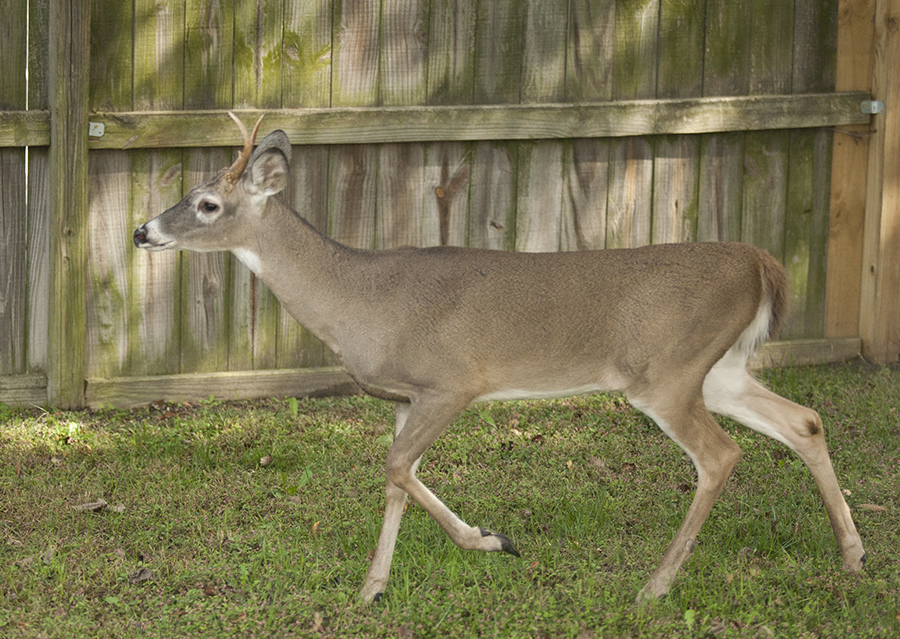
I don’t know why the deer decided to stay. Maybe he was exhausted. Maybe he didn’t like how it felt, going over a fence without knowing what was on the other side. Maybe he was relieved to find a yard with no dogs, a pair of small water gardens, some weedy pollinator beds, and a few spots of semi-cover.
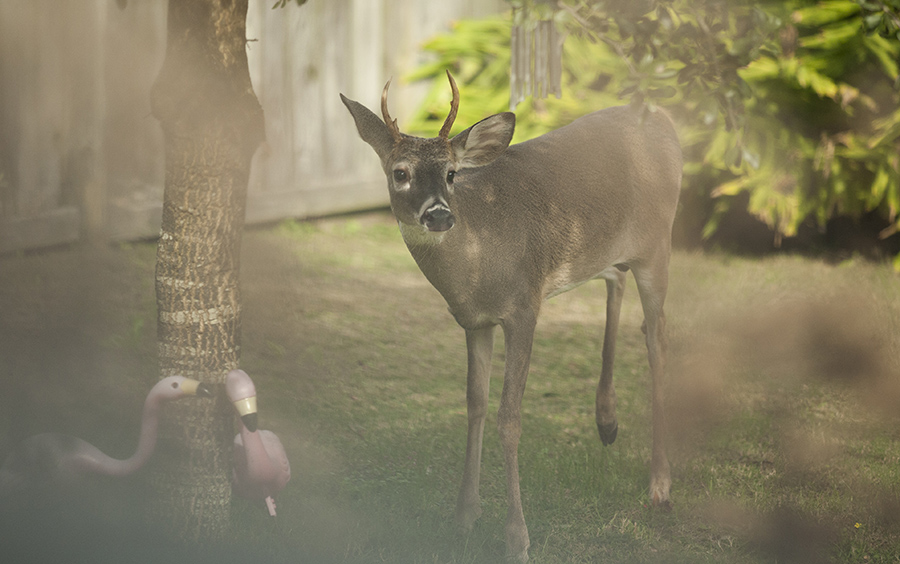
I was delighted to have a deer guest. Even more delighted to run into an animal control officer who was cruising through the cul-de-sac. She had been alerted to the deer’s mid-morning residential antics and seemed delighted, herself, to find him. She advised me to let him rest for the day, if he would, then open the gate at dusk so he could find his way out. I did, and he did.

In this metaphor, I am neither the deer nor the suburbs. I’m the long-unemployed, middle-aged woman who lives on a cul-de-sac, is trying to give her yard back to the earth, and needs a new skill set.

I have a bachelor’s degree in biology (BS), a doctor of veterinary medicine degree (DVM), and obsessive compulsive disorder (OCD). I’m a BS DVM OCD.

I didn’t know about the OCD until I was in my late twenties, though it started affecting my study and work habits while I was in school. I floundered through an internship, where the pace and stress exacerbated my symptoms and resultant anxieties, then lucked into a great job.

I loved my job and my clients and my patients, and I developed coping mechanisms for the OCD and anxiety. But love and coping mechanisms only got me so far. Eventually I fell apart, changed my work schedule, and fell even more apart. I retired from veterinary practice when I was a young veterinarian, and I’ve been unemployed since.Unemployed, but not idle. I’ve taken care of myself, my family, and my tiny acre of world. And I’ve written many words.

Poetry, fiction, creative non-fiction, nature rambles, random histories of veterinary medicine, random histories of randomness. For more than a decade, I collected thoughts into words and words into files and researched whatever caught my interest. I submitted and published some of my writing, and I was once paid $5 for a poem.

And, while I’ve stopped submitting and publishing in recent years, I’m still writing. Since January of 2020, I’ve been studying professional writing through Old Dominion University’s online Graduate Certificate program.

A science major in the humanities silo. What next?

Hopefully, next will be a yard given back to the earth, a deer surrounded by less fence and more wilderness, and a world without educational silos. (More on these in later posts.)

Mine is a story of immense and unearned privilege, but it is also a story of gratitude and listening. My hope is that, in the end, it will be a story of kindness.


I regret that I do not have a list of links for this post. Much of my reading, over the past two years, has been books instead of internet content. Here are a few of them. If you’ve read these books, I would love to hear your thoughts. Recommendations for further reading are always welcome.

Cultures and Organizations: Software of the Mind by Geert Hofstede, Gert Jan Hofstede, and Michael Minkov

How Forests Think: Toward an Anthropology Beyond the Human by Eduardo Kohn

From Black Codes to Recodification: Removing the Veil from Regulatory Writing by Miriam F. Williams

Silent Spring by Rachel Carson

Historical Capitalism by Immanuel Wallerstein

Trans-Kin: A Guide for Family & Friends of Transgender People edited by Eleanor A. Hubbard and Cameron T. Whitley

The Rhetoric of Risk: Technical Documentation in Hazardous Environments by Beverly Sauer

The Structure of Scientific Revolutions by Thomas S. Kuhn

A Few Butterfly Answers

I ended yesterday’s post about Black Swallowtail Butterflies with a few questions:

I wonder if there is enough summer left for them? Will they emerge and mate this year? Or will they wait until spring, pausing the cycle as they sleep through winter’s dreary interlude?

Chrysalis August 26

This morning, the yard answered with uncharacteristic directness. There is definitely enough summer left — plenty of time for another generation of swallowtails.

Butterfly August 27

Butterfly August 27

Butterfly August 27

Of all the remaining chrysalises, why should the one I photographed yesterday be the one to open today?

Butterfly August 27

Maybe because I had some time available today, for research? Why else would she allow me to photograph the strange fork at the end of her proboscis? I’ve noticed something similar before, but not on all of the butterflies. What’s going on here?

Butterfly August 27

This afternoon I learned that many species of butterflies emerge with their proboscises incompletely fused. After emerging, they mechanically connect the two halves, forming a tube. This has to be done fairly quickly, or the butterfly may end up with a permanently divided (and therefore non-functional) proboscis. In the above photo (taken only minutes after emergence), the process simply wasn’t complete.

The following enlargement, cropped from one of yesterday’s emergence photos, shows the groove that results when the two halves of the proboscis are properly connected. (The tip of this proboscis had a tiny fork remaining, evidence that the butterfly still had a bit of work to do.)

Butterfly 2 August 26

So much complexity, packed into so small a creature. Wonders and miracles in every detail.

Butterfly August 27